
Using MikroTik SNMP Traffic Monitoring by identifying OID to poll specific Queues usage on MikroTik via PRTG to get a visual graph of traffic. A useful tool for monitoring and troubleshooting.
Firstly if not already installed, go to: https://www.paessler.com/download/prtg-download and install the free trail. PRTG allows a full trial for 30 days however this period you can continue to use for free for up to 100 sensors.
Step 1: Enable SNMP on MikroTik
For this we need to create an SNMP v3 user profile and enable the process.
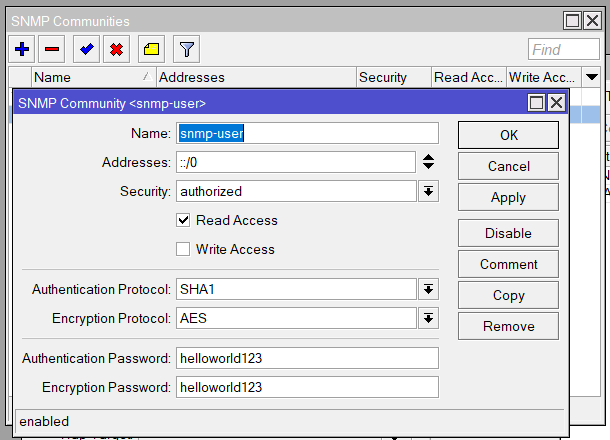
Go to IP > SNMP and click on Communites. The add a new one. I would always recommend using version 3 but for simplicity you could use v2c and just use a community string.
Set the following:
| Name: snmp-user (the user name for the SNMPv3 credientials) Security: authorized Authentication Protocol: SHA1 Encryption Protocol: AES Authentication Password: <secure password – not as I have used!> Encryption Password: <secure password – not as I have used!> |
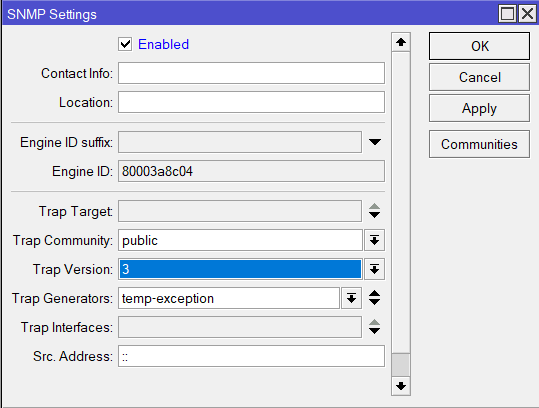
Then OK this and close the SNMP Communities window and tick Enabled and Trap Version 3. We don’t need to change the Trap Community as only applicable if we use version 1 or 2c.
Step 2a: Firewall (using Address List)
If you have setup an allow rule above your drop rule which references an Address List as a source and allows on the input chain (see YouTube video below for more on this), then make sure the IP of your PRTG server is in the Allow List. For my example the PRTG server is on the same LAN as my MikroTik.
https://www.youtube.com/watch?v=B6GEYy7nFyU
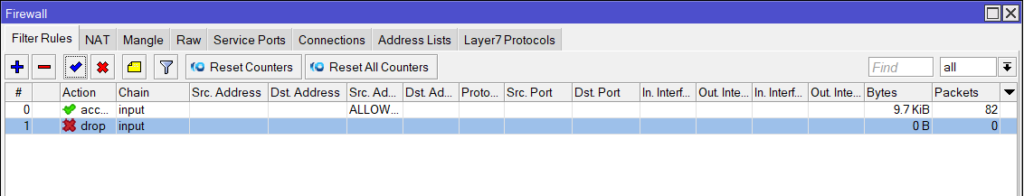
Step 2b: Firewall (using Input Rule)
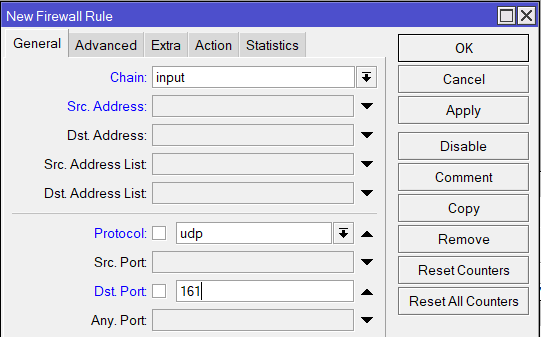
This option is that we create a dedicate allow rule on the input chain for either the source IP (the machine running PRTG) and place that above our deny rule.

The other option is that we allow the SNMP protocol (UDP 161). This option does allow for other SNMP polling to occur from unknow devices on our network however without those SNMPv3 credentials any requests would be unsuccessful but would still generate unwanted noise so best to lock down to IP or ideally both
Step 3: Add Device to PRTG and Test SNMP Polling
If not already done so, add the MikorTik as a device:
If the Local Probe and assign a Name and IP address of the MikroTik that is reachable from the machine PRTG is running on (the IP used during the Firewall setup). Then scroll down and under then SNMP settings and if uncheck this option it allows you to set the SNMP settings for this device only, otherwise you can configure the SNMP settings for multiple devices at a parent level and subsequent devices will use these settings.
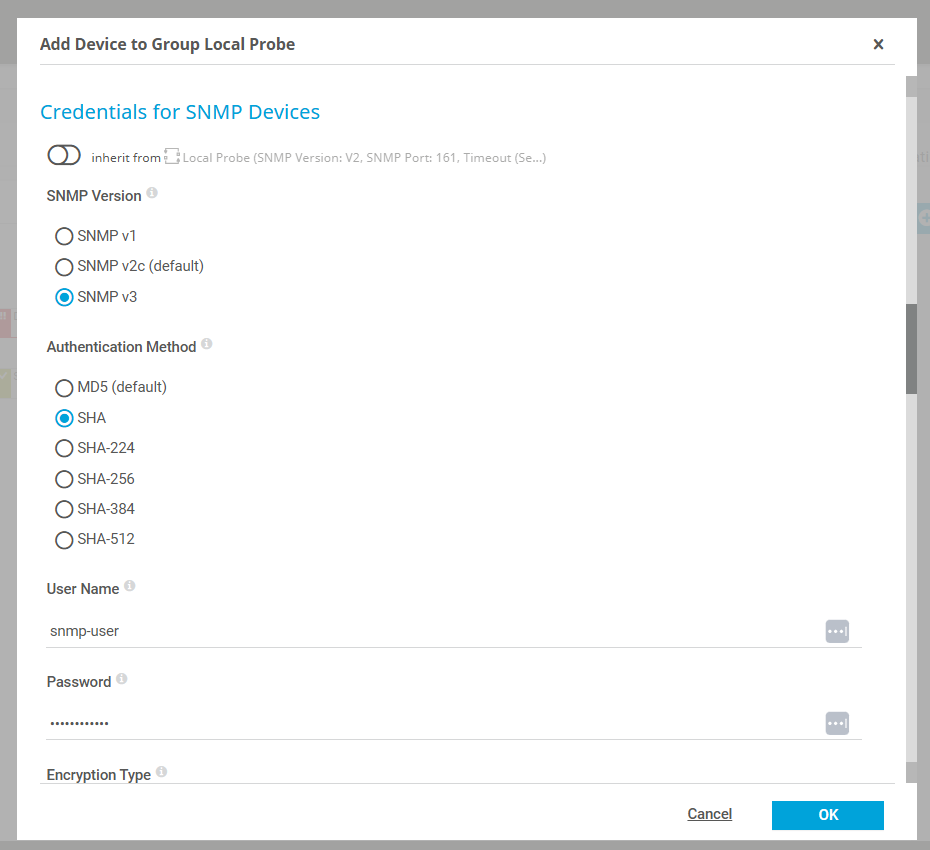
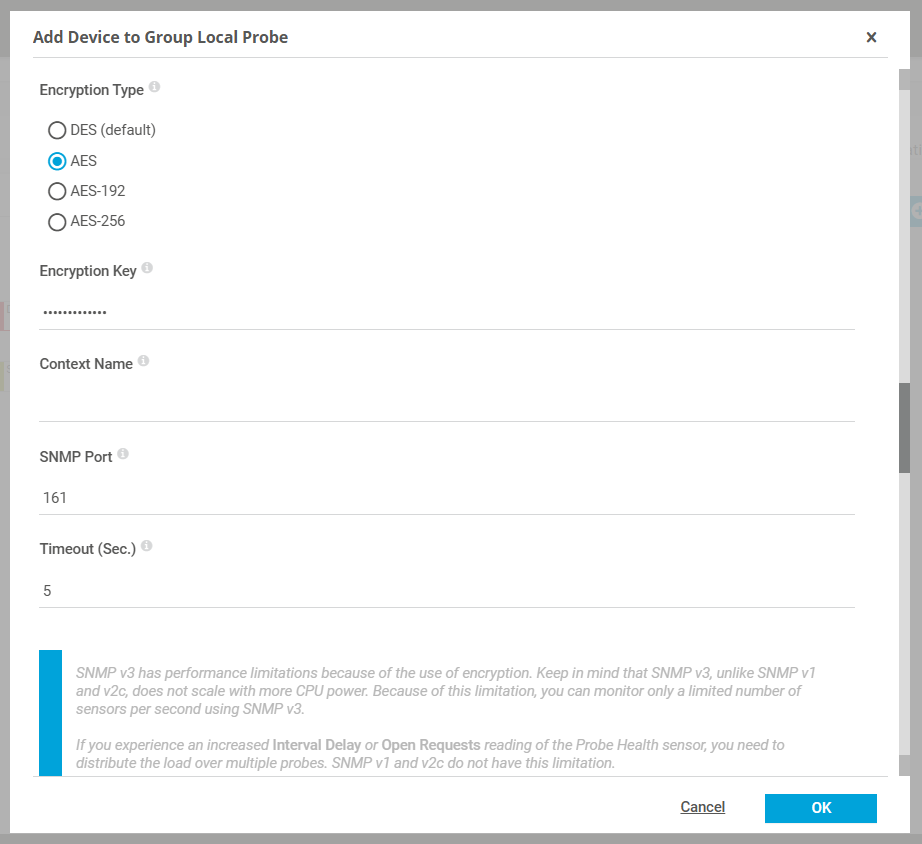
For this example we will set these for this device only and use the following settings:
| SNMP Version: SNMP v3 Authentication Method: SHA Username: snmp-user (the name of the Community we set on our MikroTik Password: (The Authentication Password set on the MikroTik Community) Encryption Type: AES Encryption Key: (The Encryption Password set on the MikroTik Community) |
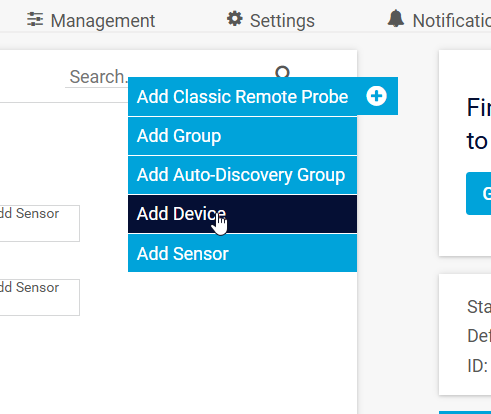
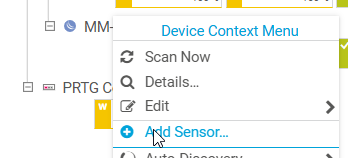
Now right click on the newly added device and click Add Sensor
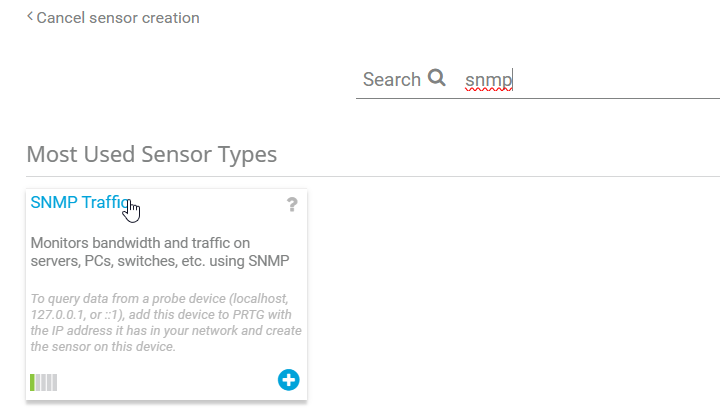
Search for snmp and click on SNMP Traffic
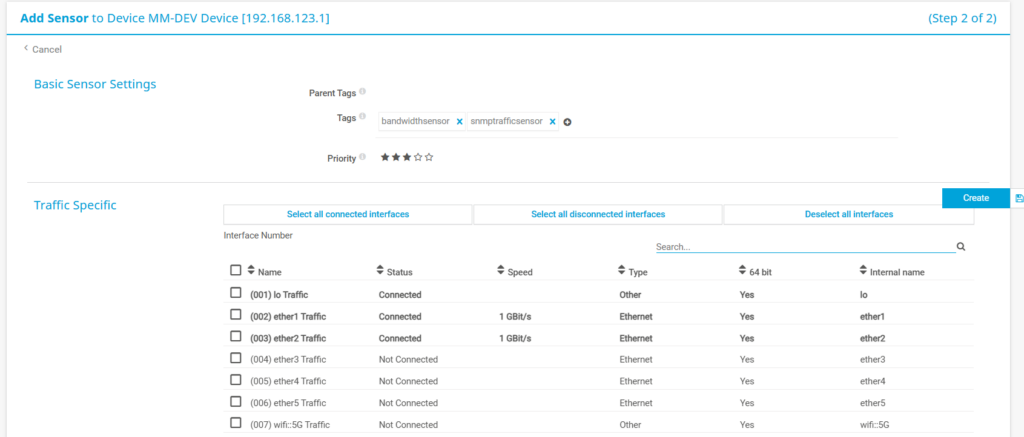
If you get to the next window showing the interfaces on the MikroTik then it means PRTG can communicate with your MikroTik using SNMP. If not, review your SNMP user details and firewall rules to confirm they are set correctly and match.
Step 4: Discover Queue OID
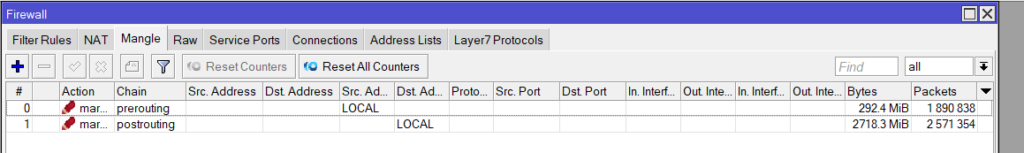
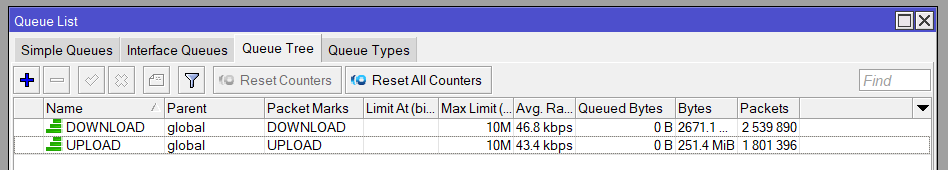
For this example I have created 2 basic Queue Trees including 2 Mangle Rules to match the local LAN traffic and apply 10Mbps both directions. For more indepth information for configuring Queues please see my other tutorials and videos: MikroTik Bandwidth Management
Now to discover the unique OID for the bytes for each Queue open a terminal and type:
/queue/tree/print oid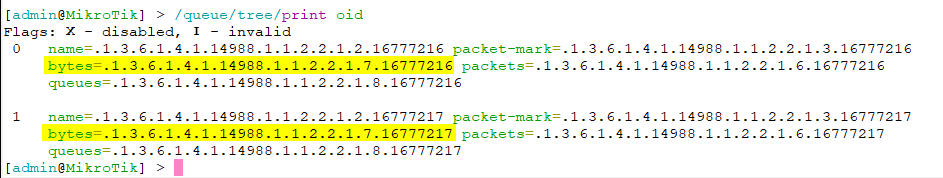
This will print the OIDs for each Queue in the Queue Tree. Locate the one for bytes and copy both after the = (including the first . )
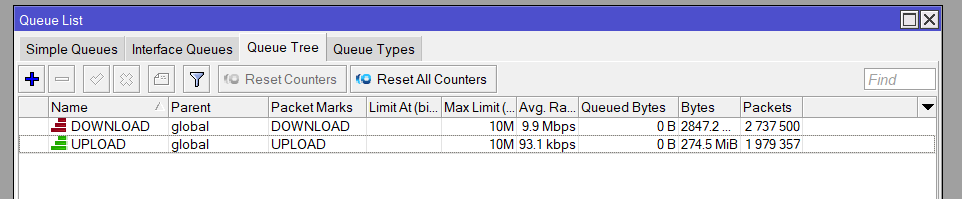
To identify which queue is which you can run the following and the numbers match based on the names:
/queue/tree/print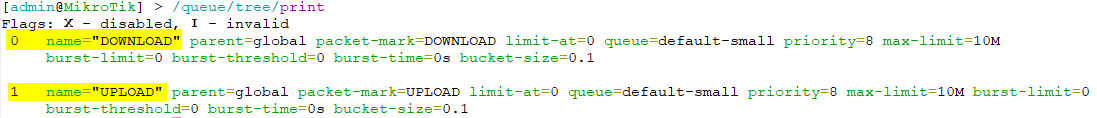
Step 5: Creating Queue Traffic Sensor on PRTG
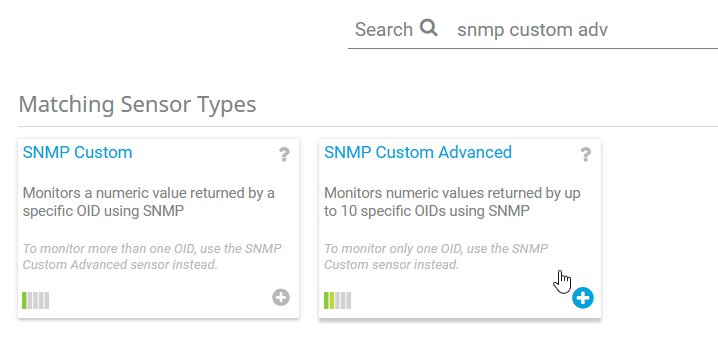
On PRTG create a new Sensor for the device as per Step 3, but this time search for “snmp custom advanced” and click on SNMP Custom Advanced:
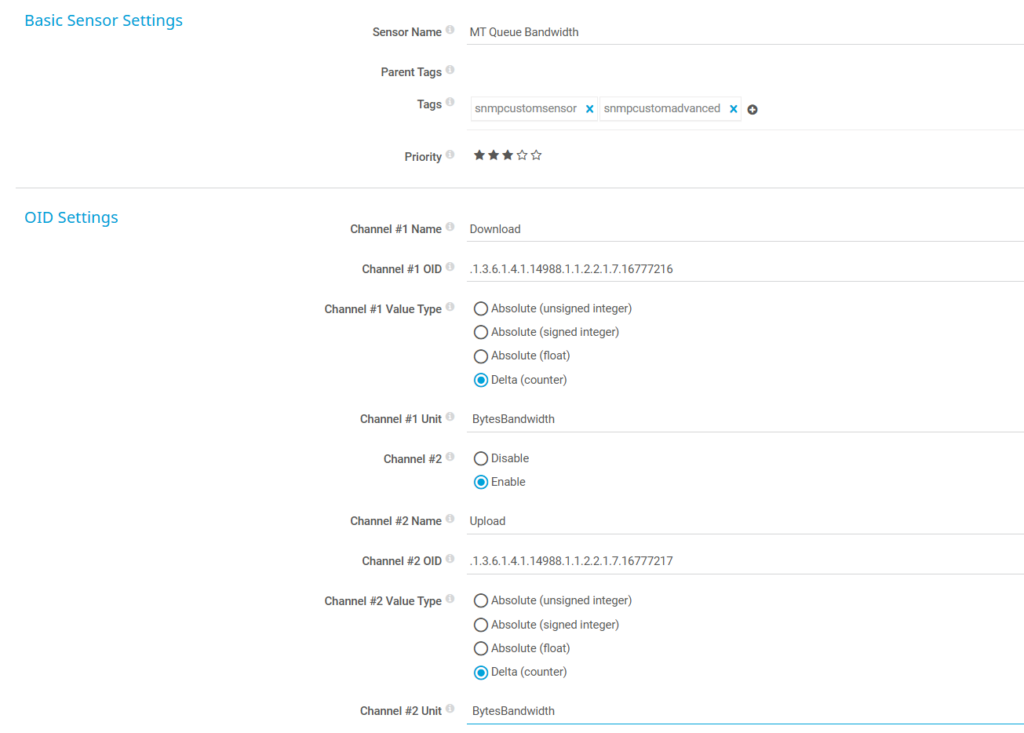
Now we name our sensor anything identifiable, but both Download and Upload will be in the same sensor & graph so the name can reflect the combine use of the graph. However, it’s optional to have a sensor per direction (upload/download) if required.
For the OID settings, start with either Upload or Download and set Channel #1 Name as either, then the OID for the relevant OID captured from the MikroTik.
Set the Value Type to Delta (counter) and Unit as BytesBandwidth
Now enable Channel #2 and repeat steps for the other direction.
Then click Create
Step 6: Testing and Review
Now that the sensor is setup, it will take a few minutes to begin polling. Once it is we can generate some traffic on our queues to view the usage.
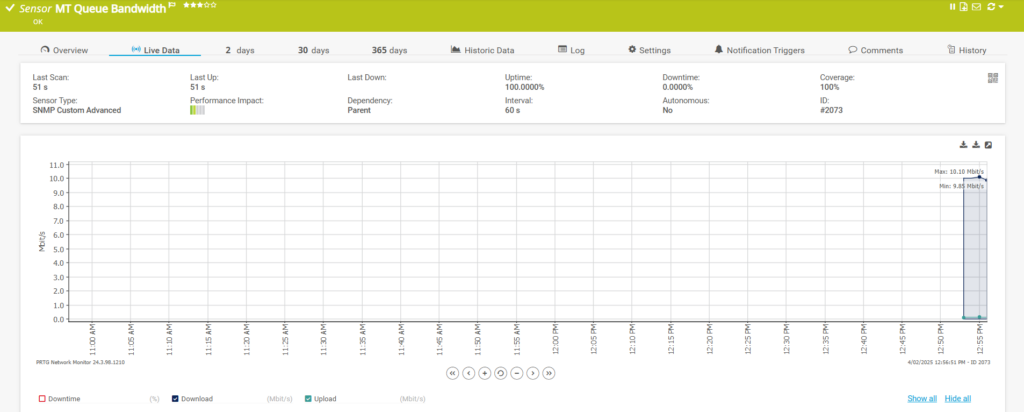
As I’m testing I’ve set the queue limits low to only 10M to provide a visual result. I began a large download (a Linux distro ISO) and the Download queue maxes out:
After 5 mins we can then begin to see the results in our graph.